Pancom AS / Digital
Interactive quarterly report for Pancom AS
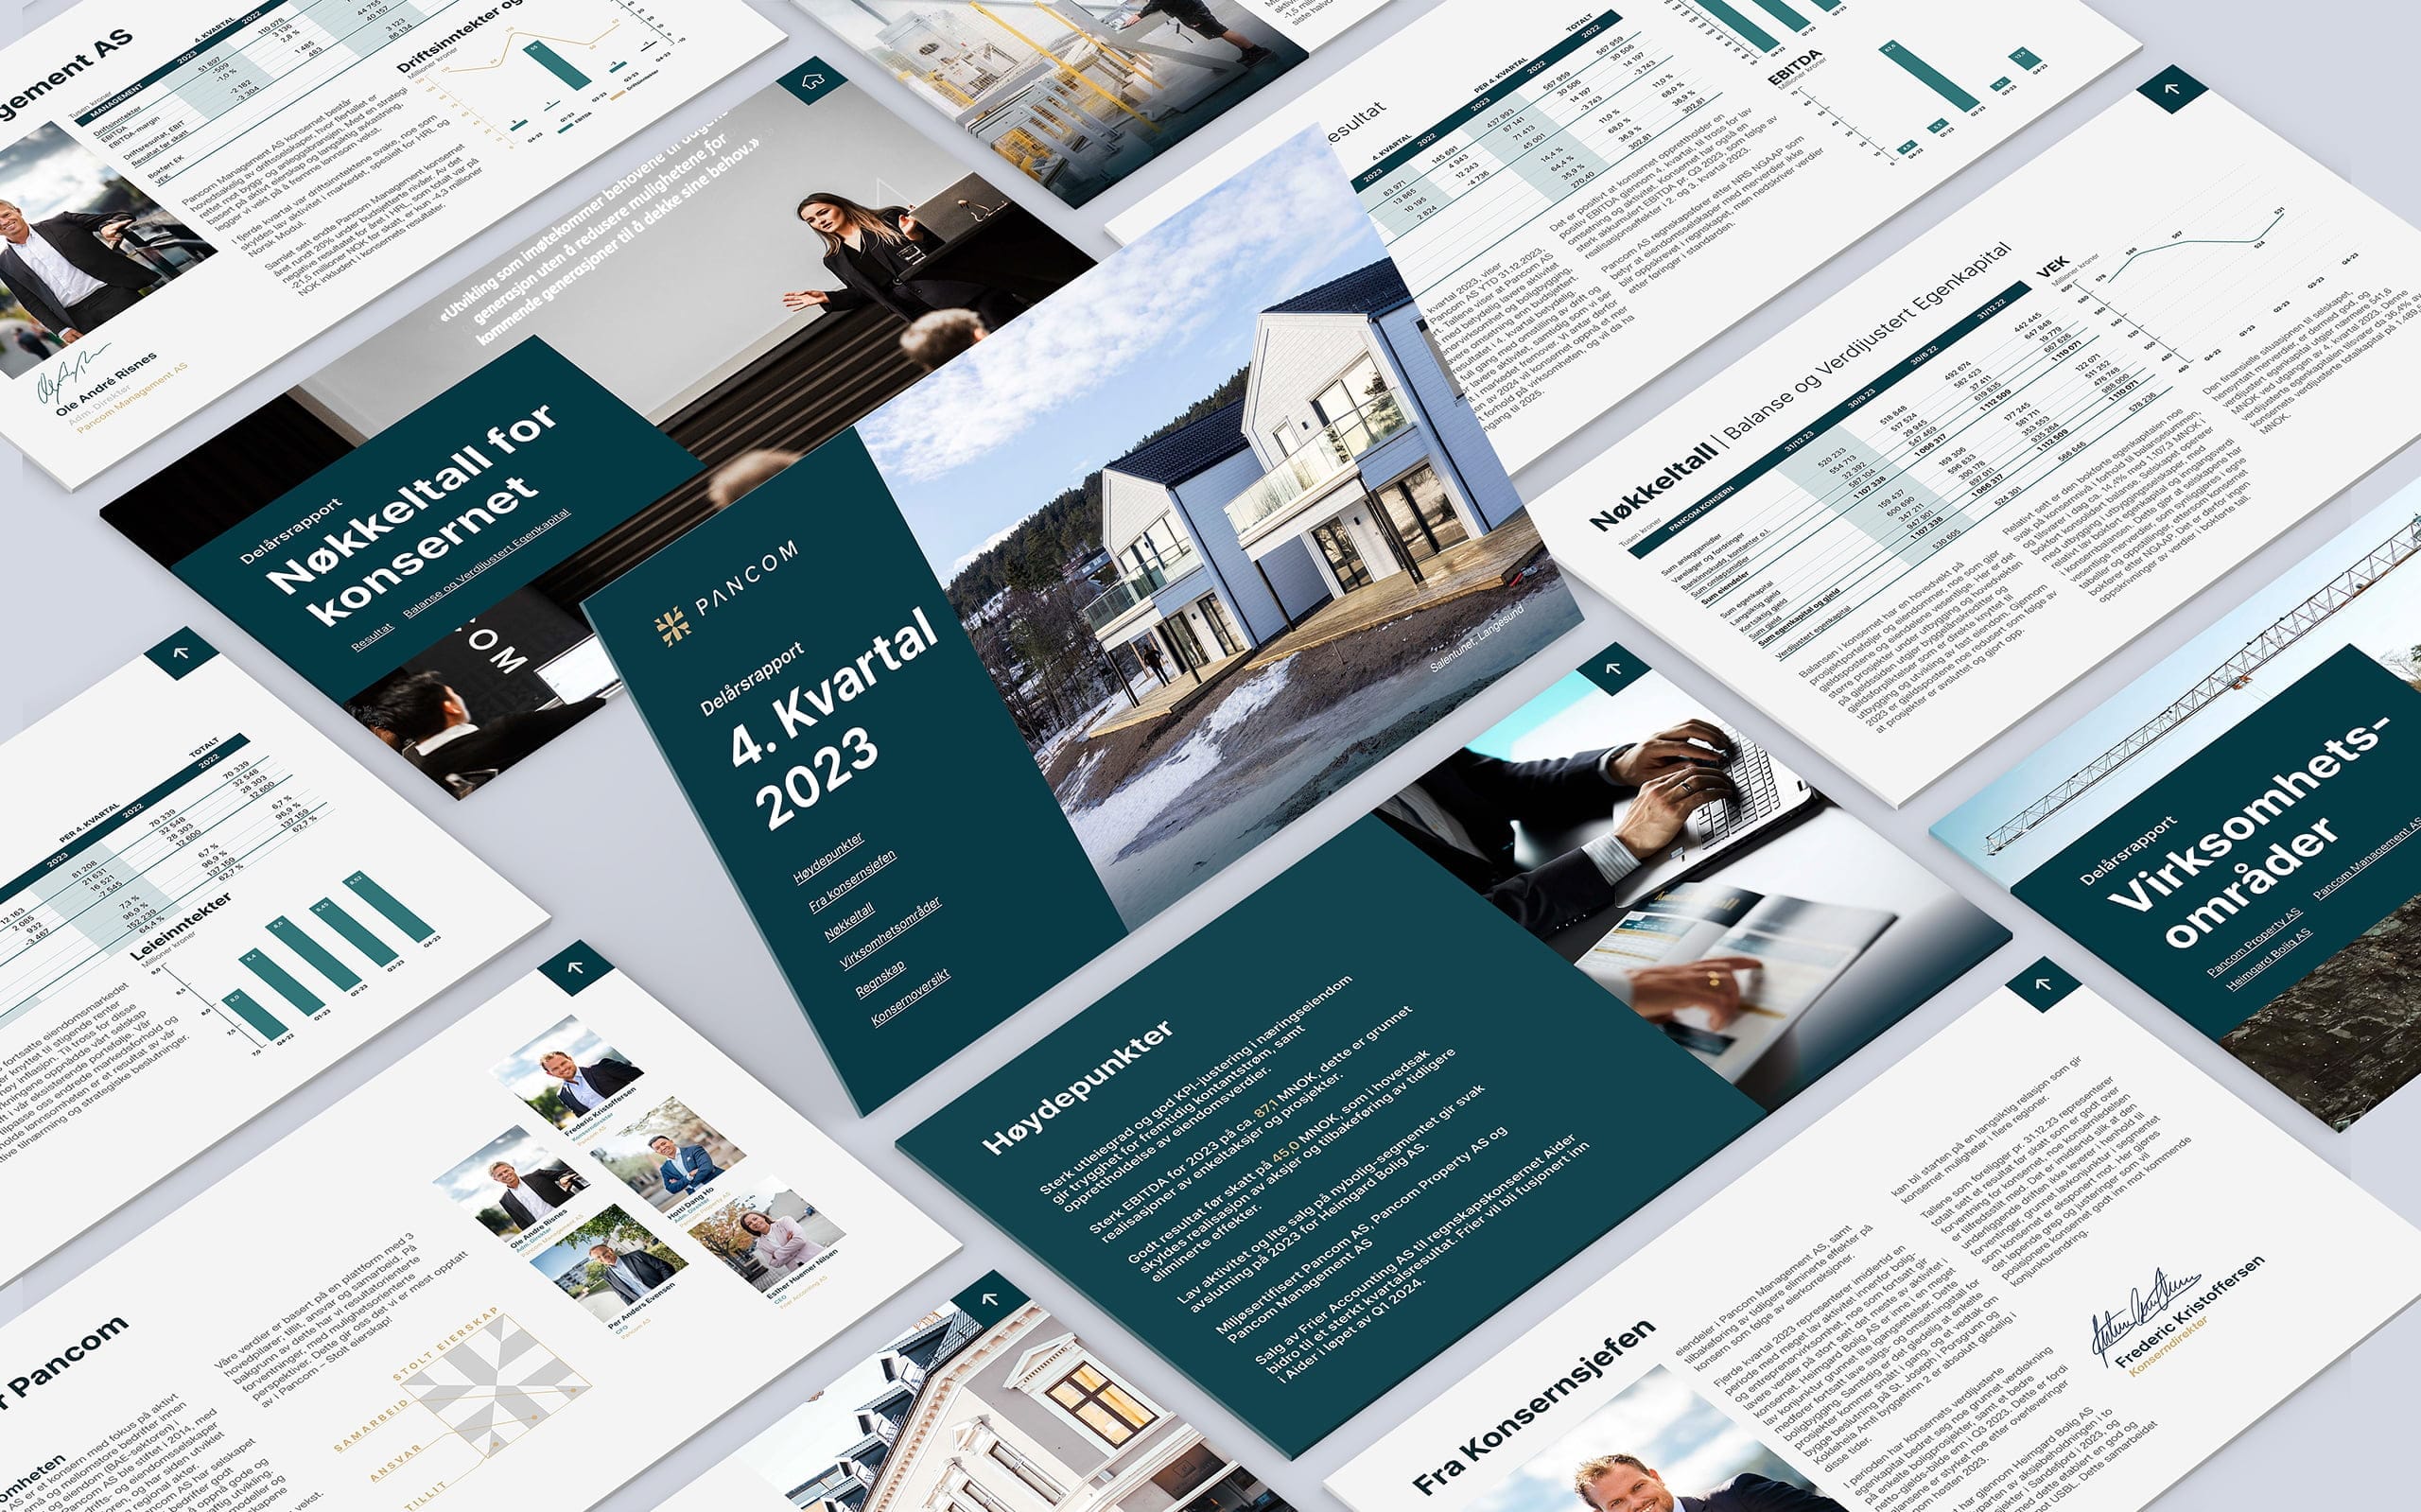
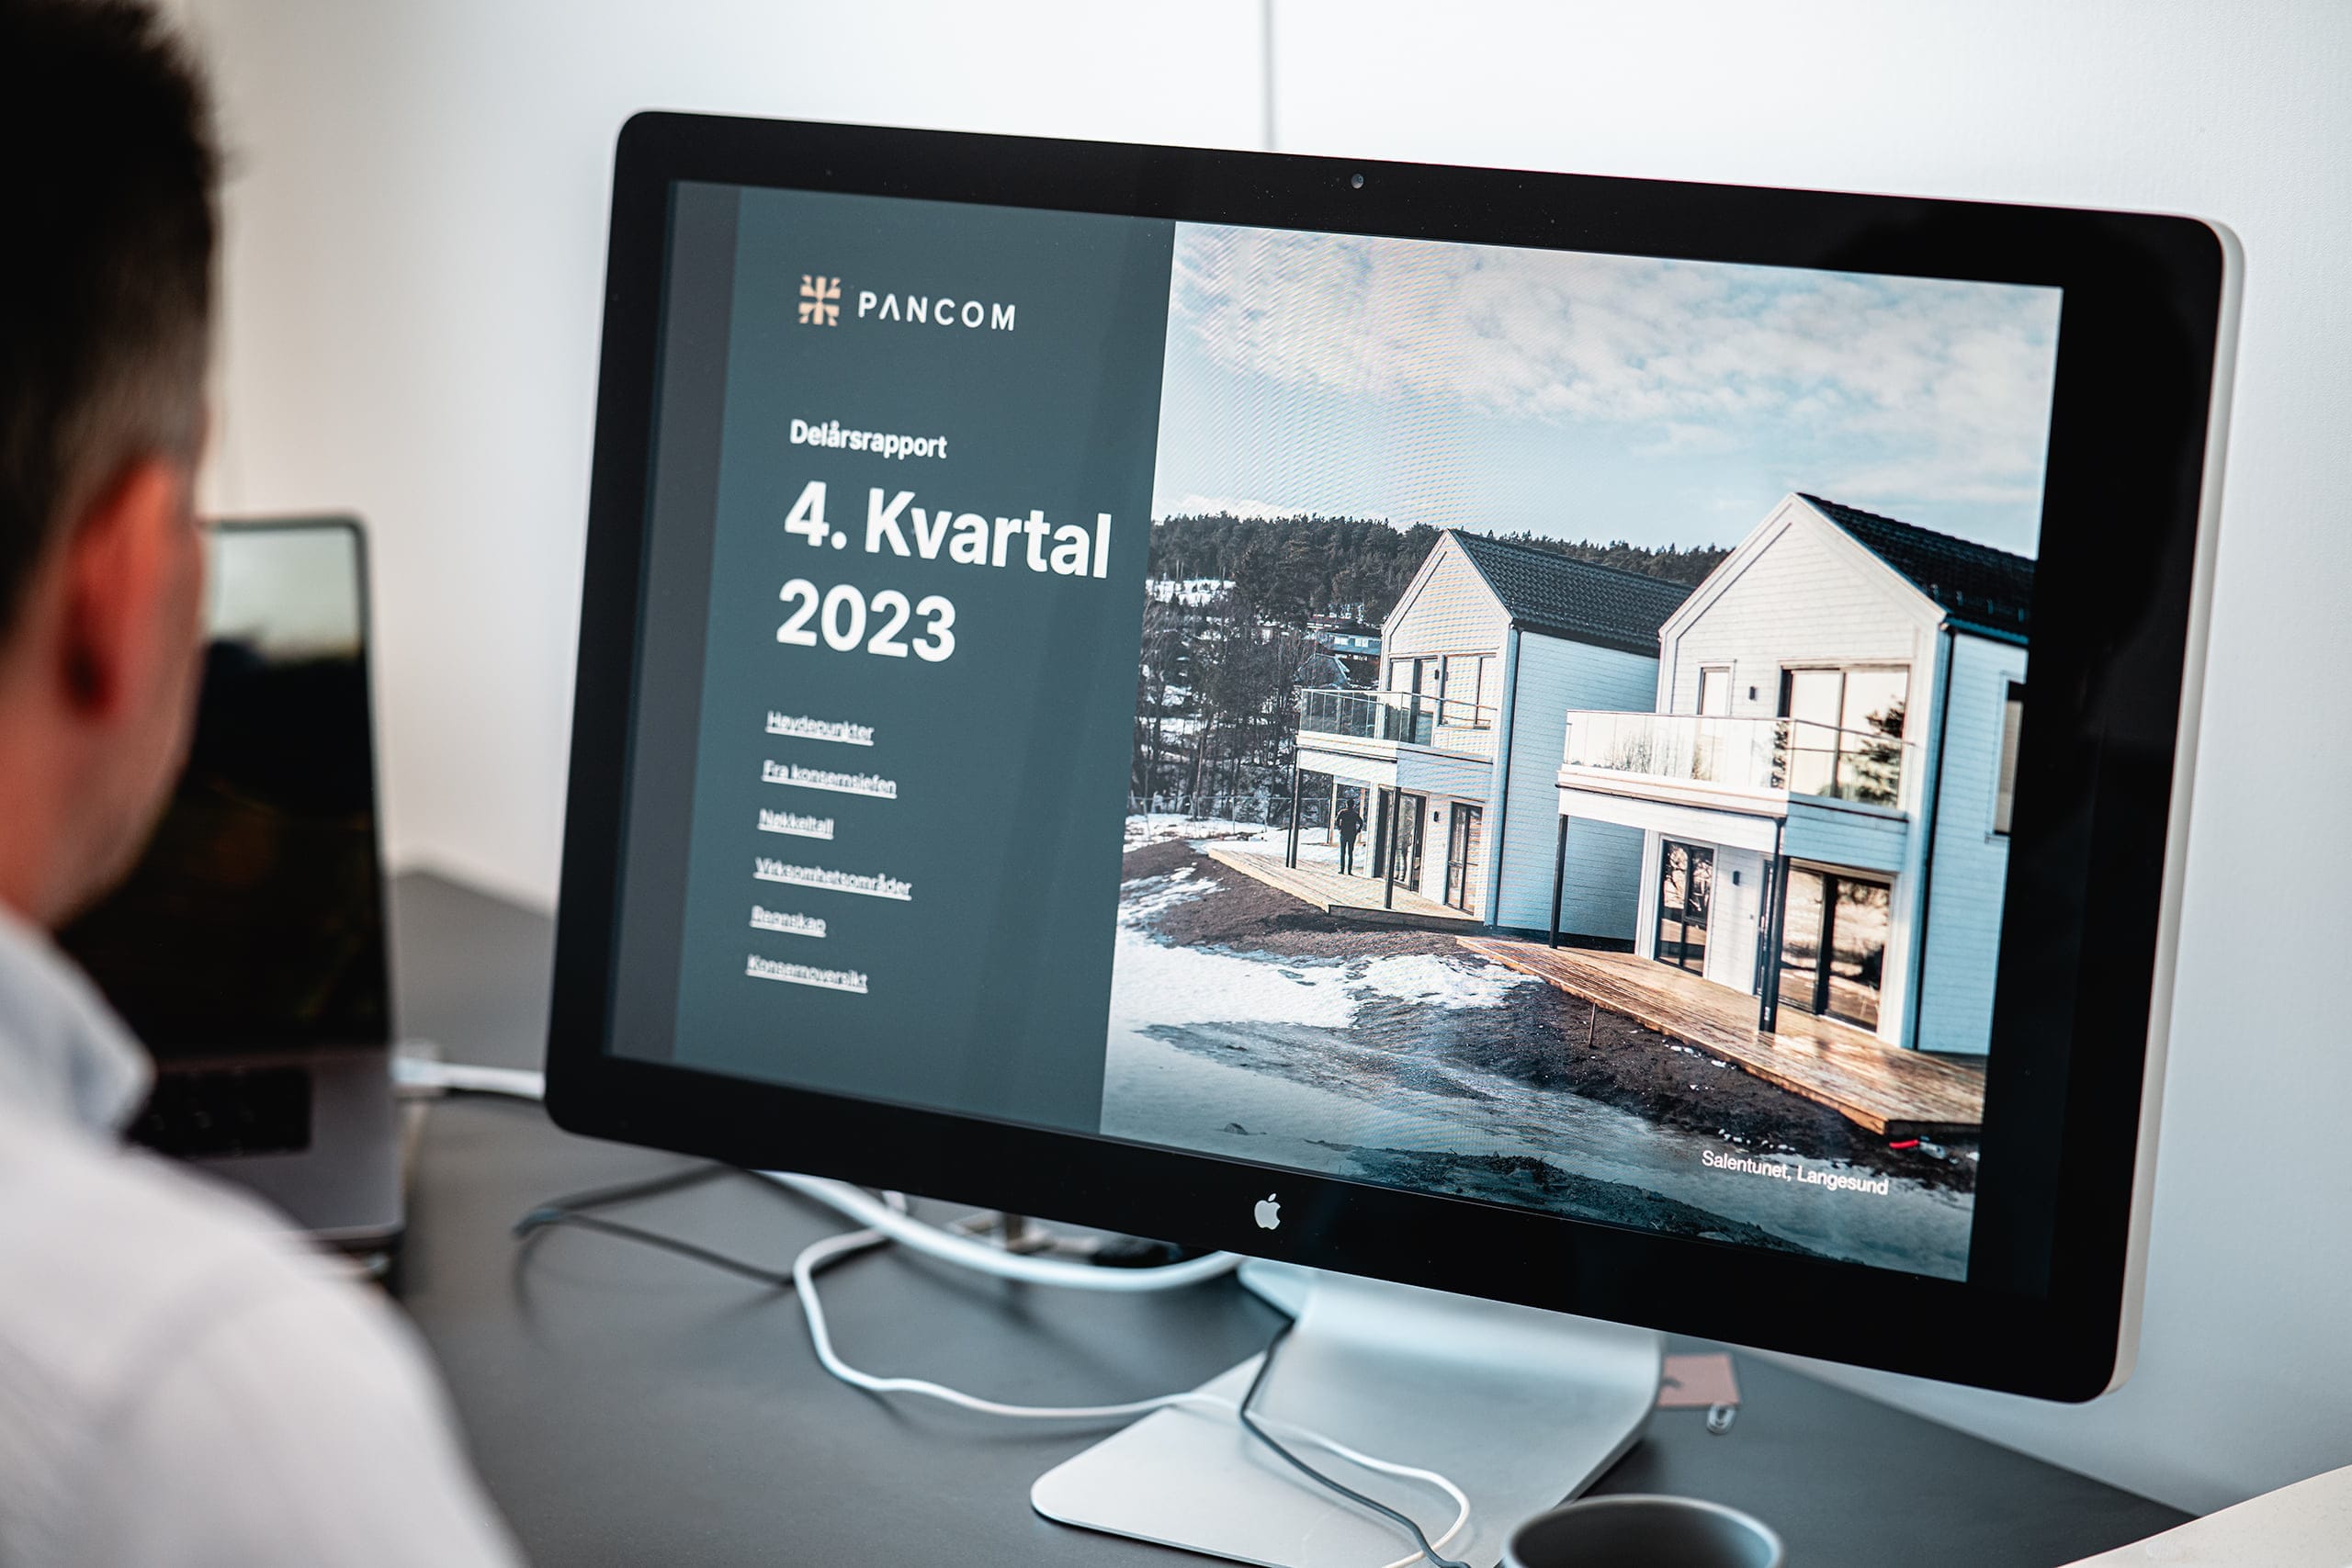
What defines a good report is that it is informative and easy to maneuver. Pancom's quarterly report for the fourth quarter of 2023 is a great example of how an interactive PDF can provide clear and concise data while maintaining a user-friendly format.
The report is sectioned into 6 parts so that the user can easily find relevant content. By clicking on a subject in the table of contents, you are sent directly to the correct place in the report. This is particularly useful when you need to refer to specific data or want to explore a specific area. The report is structured as a clickable PDF with navigation for a better reading experience, like on a website.
The interactive report offers several advantages:
Ease of use: Clickable links allow readers to quickly jump between sections, making information easily accessible.
Clear structure: The report is organized into logical sections, such as key figures, business areas and accounts. This provides a good overview and makes it easy to find the necessary information.
Detailed content: The report provides an in-depth insight into Pancom's performance throughout the quarter, with key figures and analysis of various business areas.